DATA INTERPRETATION
In the year 2020, MLK Airlines is headquartered in New York City (NY). They run flights between various pair of cities. Since the recent sharp increase in the number of cities served has made it difficult to keep track on the status of each city, the new logistics manager decides to classify the cities on the basis of how connected they are to NY. He assigns each city a Connectivity Number (CN), with NY itself getting a CN of 0, using the following rules.
- If a city X has a direct flight from NY, then it is awarded a CN of 1.
- If a city Y does not have a direct flight to NY, but has a direct flight to a city such as X with a CN of 1, then city Y is awarded a CN of 2, and so on, with the CN for a city being the number of flights in the shortest chain of direct flights connecting that city with NY.
- Thus, if a new direct flight is introduced between a city with CN of p and another city with CN of q (where p ≥ q) then the CN of the first city remains unchanged (i.e. p) while that of the second becomes p + 1.
- A city with no chain of direct flights connecting it to NY has a CN of infinity.
Over the next few years, the airline is planning to start new flights to seven cities, A, B, C,D, E, F, G. As of 2020, none of these cities has a direct flight to NY; one of the seven citie has a CN of infinity while F has the smallest CN and E the largest CN among the other six cities.
In 2021, MLK introduces three new pairs of flights between B and F, F and E, and B and E. No other flights are introduced during 2021. As a result of this, the average CN of seven cities at the end of 2021 comes to 4. Also, at the end of 2021, four of the seven cities have the same CN while the remaining three have distinct CN values.
In 2022, MLK introduces flights connecting A and F. No other flights are introduced during 2022. This reduces the average CN of the seven cities by 1.
QUESTIONS:
1) If F's CN in 2020 is x, then answer following in terms of x :
- What is the CN of B in 2021?
- What is the CN of E in 2021?
- What is the CN of A in 2022?
- By how much does A's CN decrease in 2022?
- What is the CN of A in 2020?
2) What was the CN of E at the end of 2022?
a. 2 b. 3 c. 4 d. None of these
3) What is the CN of B in 2020?
a. 2 b. 3 c. 4 d. None of these
4) How many cities among the given seven had the same CN in 2020?
a. 2 b. 3 c. 4 d. None of these
5) What was the CN of A in 2021?
a. 2 b. 3 c. 4 d. None of these
6) How many cities did not change their CN between 2020 and 2022?
a. 2 b. 3 c. 4 d. None of these
7) If G had the highest CN among these 7 cities at the end of 2022, what was its CN?
a. 2 b. 3 c. 4 d. None of these
1) Given, F has the lowest CN of x.
New flights started in 2021 are between B & F, F & E and B & E.
1 & 2) Now CN of B=E=x+1;
3 & 4) In 2022, the flight between A & F is started making the CN of A =x+1
Given that there was a reduction of 1 in the average CN => CN of A in 2021 was x+1+7=x+8
2) In 2021, We know that the CN of B and E is x+1
Also, CN of 4 cities was the same and other 3 were distinct and CN of A=x+8
ð 4 cities had a CN of x+1
ð CN of F =x,
ð CN of A= x+8
Let CN of 7th city be y;
Given average CN of all cites was 4
ð 4(x+1) + x+8+x+y=28
ð Solving this we get if x=1, y=10 or x=2, y=4
Now, CN of A in 2021 and 2020 is x+8 and E has the highest CN
ð CN of E2020>x+8 and y2020
ð Rejecting x=2, y=4
ð Therefore, x=1
CN of E2022 = x+1 = 2
3) CN of B2022 = x+1 = 2
4) In 2021, 4 cities had the same CN. Out these 4, there were only 2 cities whose CN had changed in the year. Thus, 2 cities had the same CN in 2020
5) CN of A2021=x+1= 2
6) During the period, the cities which had a change in CN are: A,B and E; Thus the CN of the rest 4 cities did not change.
7) the highest CN for 2021 and 2022 is y thus CN for G2022 = 10
Hello Apoorva!
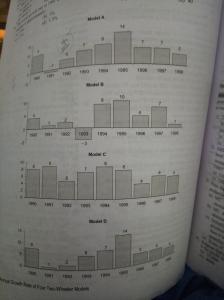
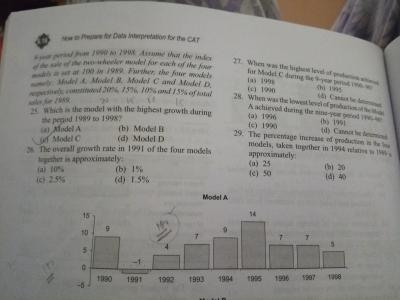
26. Growth of model 1 in 1990 is 20 x 9/100 = 21.8 similarly growth rates for model 2 is 15.6, model 3 is 10.8 and model 4 is 16.05 . Hence the total growth rate in 1990 = 64.25
Growth of model 1 in 1991 is 21.8 x 99/100 = 21.58 similarly growth rates for model 3 is 15.76 , model 3 is 11.77 and model 4 is 16.21 . Hence the total growth in 1991 = 65.32
Therefore , total growth percentage of all the four models taken together = [( 65.32 - 64.25) /64.25 ] x 100 = 1.5 % approx.
(Option D)
27. Option A
28. After 1991 each year there is positive growth rate change for model 1 . hence option B .
29. The production of four models in 1994 :
Model A : 25. 5
Model B : 16
Model C. 14
Model D. 19.5
Overall Growth : 75
Hence , the percentage increase in production as compared to 1989 = ( 75 - 60)/60 = 25 %
Option ( A)

